Central monitoring of server hard drives with Scrutiny

Everyone knows the smartmon tools from the Linux area, which can read out the so-called SMART values of hard drives and thus warn of possible problems or failures of a hard drive at an early stage. This tool is now installed almost by default in any Linux distribution.
Today, however, it should be a tool that uses this SMART tool, which on the one hand monitors hard disk values over a longer period of time and thus not only takes a snapshot, but can also display the values very clearly in a web interface. We are talking about Scrutiny.
Scrutiny is usually installed via Docker. This can be done with a few commands that set up the appropriate container. Subsequently, the web interface can be reached via the selected port on the local host or via the corresponding IP address.
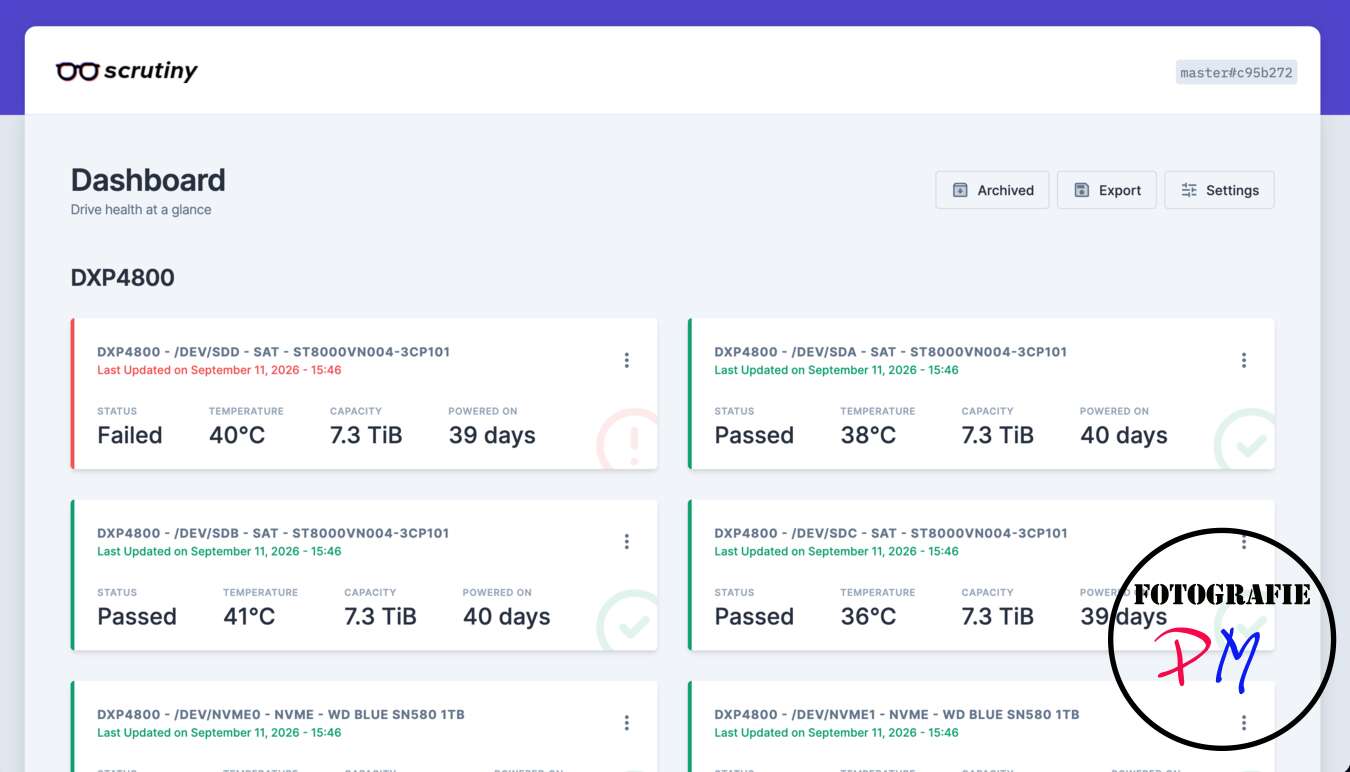
The disks available in the respective system are listed there. In addition to a general overview of the most important parameters, in particular those values, which may be classified as critical, all SMART parameters can also be displayed.
And in the screenshot above, we already see the first warning for an error in a hard drive.
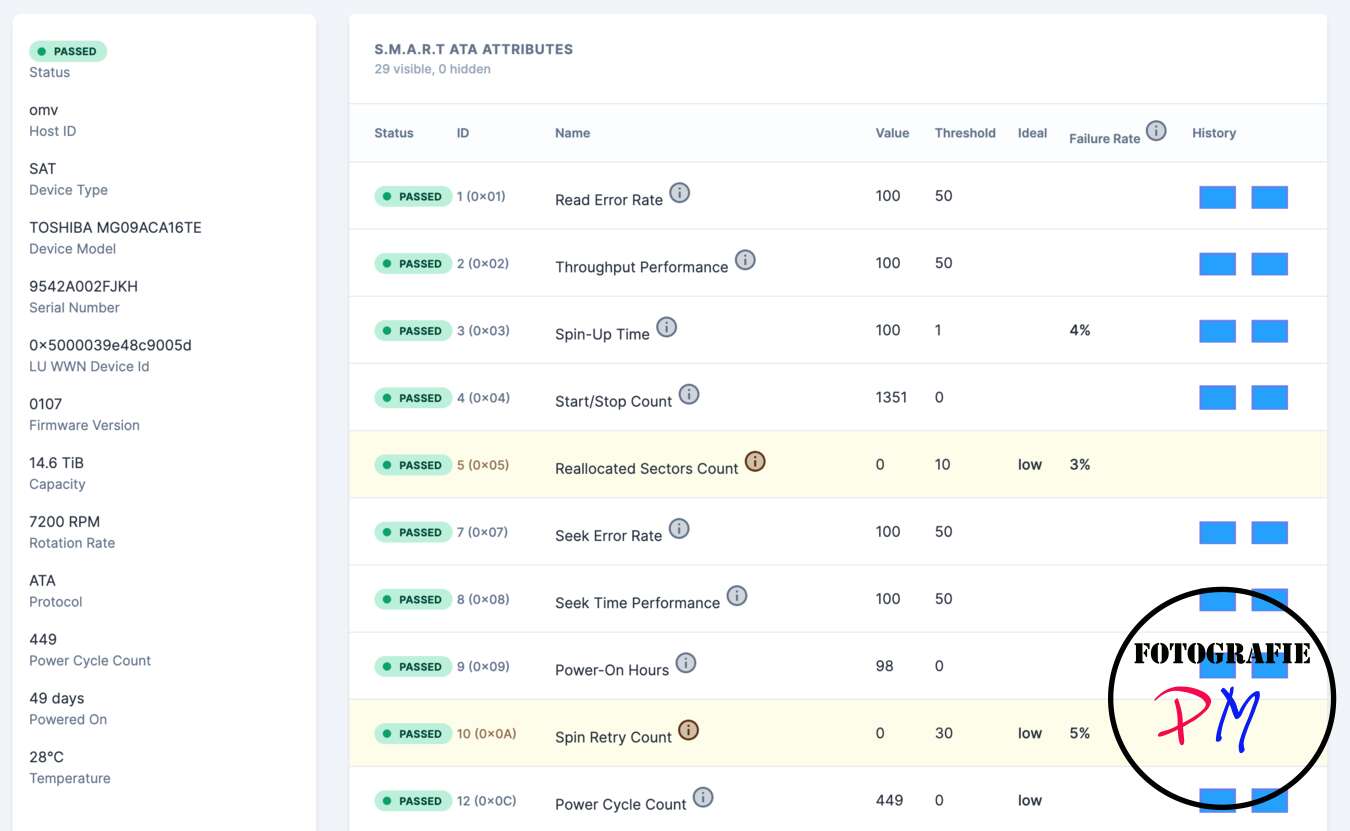
The overview reveals the most important parameters such as read errors, uncorrectable errors and so on. Other data, such as the runtime of the hard disk, are displayed alongside.
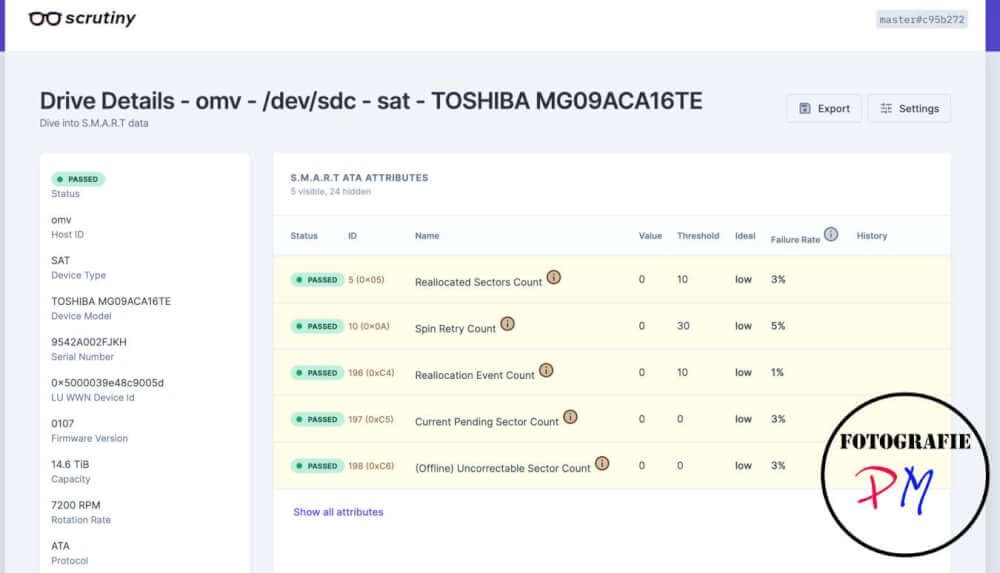 Since Scrutiny is quickly installed and consumes relatively little resources, you should actually set this up on every system.
The only problem I had with the installation was that despite the documented environment variables, a notification, for example by email or other notification services, actually did not work.
But there is also a second way to install Scrutiny, so to speak, divided into two. This is especially interesting if you want to have the web interface and the database in a central location, but want to monitor several systems at the same time.
By the way, InfluxDB is used as a database. On the other systems you can install a small client, which can be installed as a finished binary on virtually any Linux system. This reads the SMART data and reports it centrally to the web interface via an API interface.
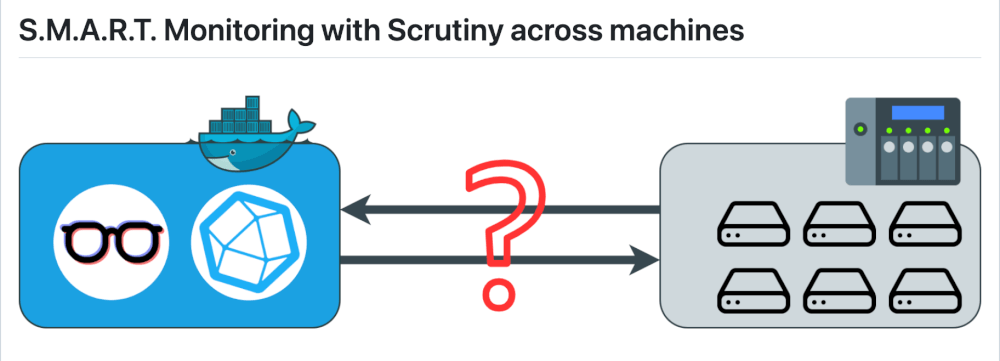
The individual systems are kept apart via an ID, which can be defined in the corresponding configuration. As a result, the web interface later contains the data of all monitored systems and the respective hard disks installed in it.
This can be particularly advantageous if the actual web interface is operated in a Docker container due to the Docker installation, for example on a host prepared for this purpose under Proxmox.
For the direct Access to the hard disk data, you would either need a privileged container there, which is not necessarily advisable for security reasons. Alternatively, you would have to read the SMART data directly on the Proxmox host. This is exactly what you can use this small client for.
I also installed this and only encountered one problem with the help of the AI: The installation of a certain client version, namely larger than 0.8.6, usually does not cause the corresponding data to be displayed in the web interface.
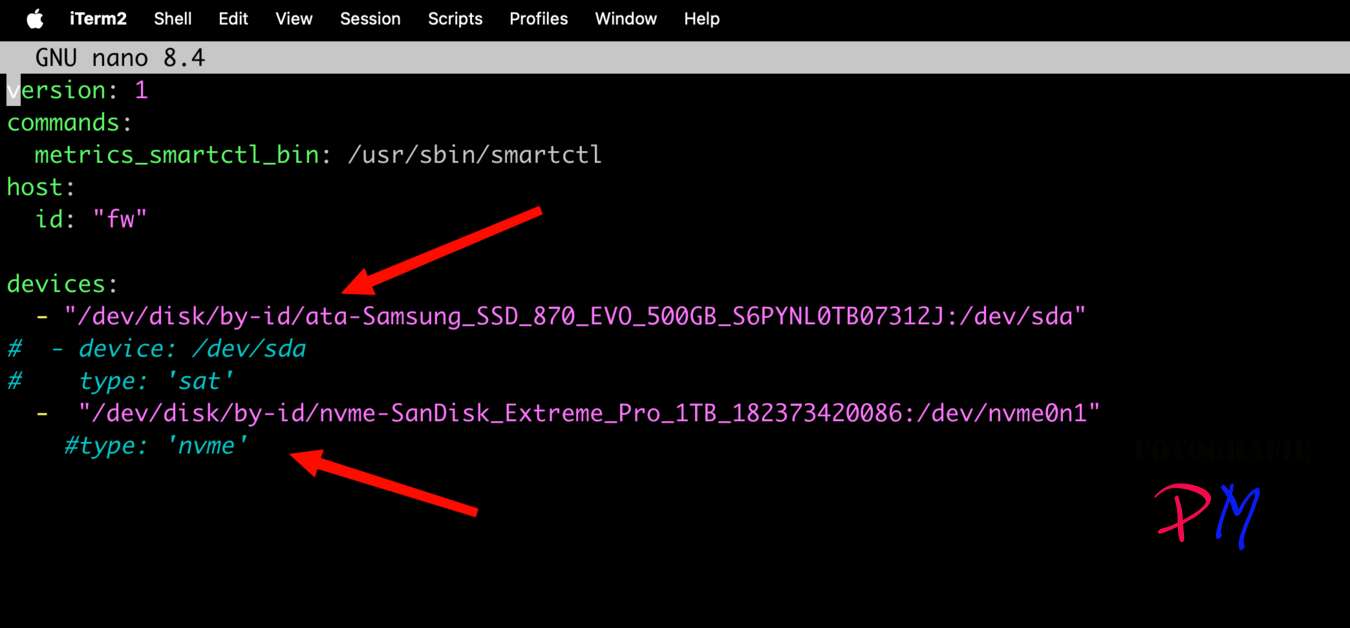
In addition, there was a very special problem with Proxmox: Scrutiny always reported that the respective hard disks that were used here did not have a UUID and in this respect a readout was not possible.
Here you can then help yourself in the configuration file for the collector with the fact that you search out the corresponding data from the directory /dev/disk/by-id and store it accordingly.
The Scutiny tool belongs to me on every server so that you can keep an eye on the Samrt values of the hard drives.
ciao tuxoche


